EYESUITE GLAUCOMA ANALYSIS

A clear view on glaucoma

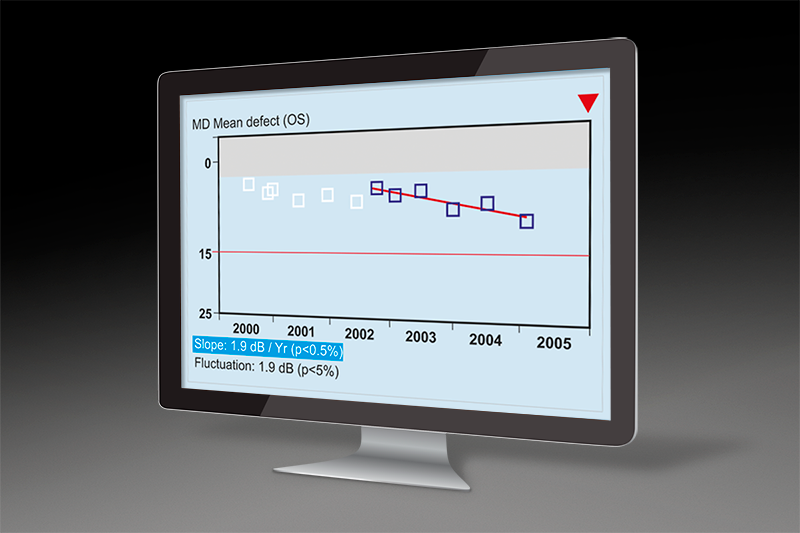
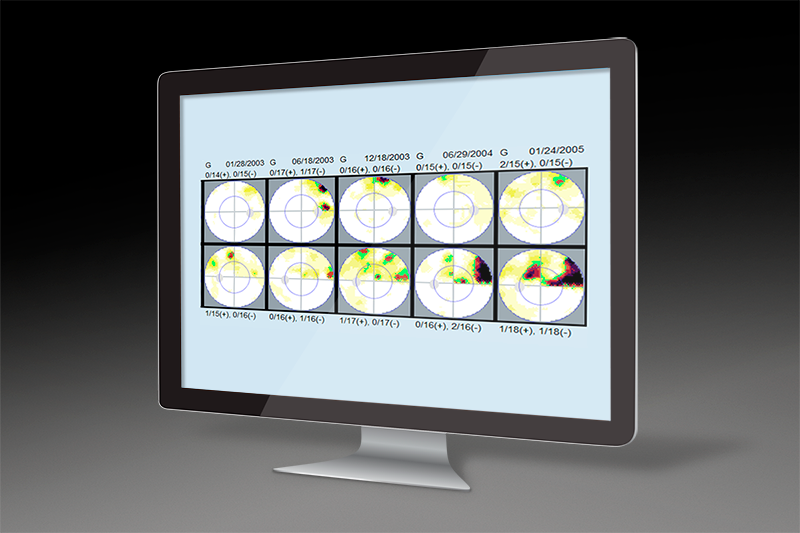
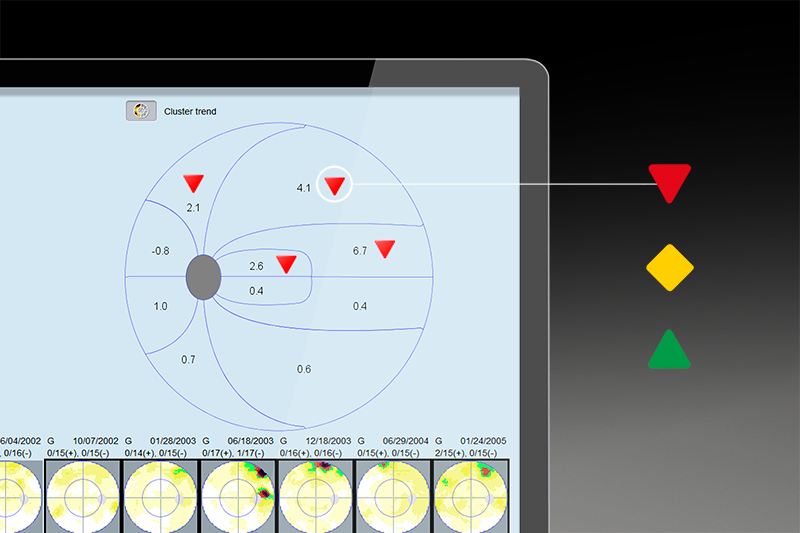
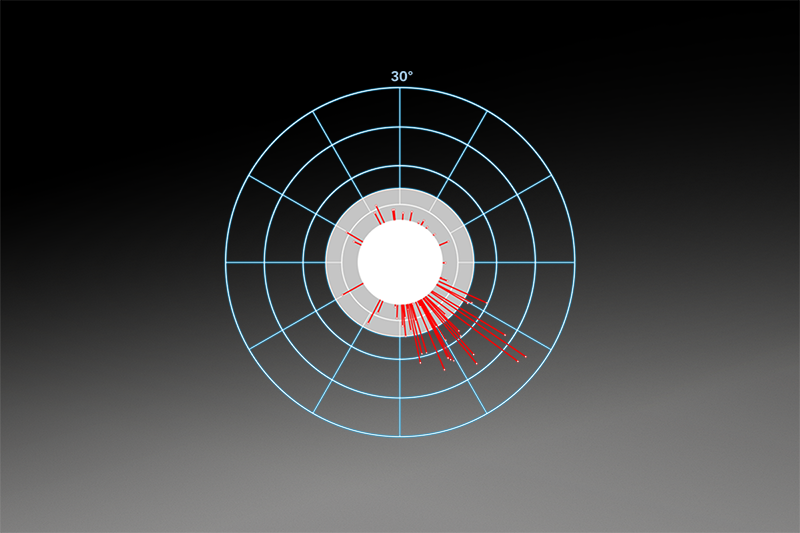
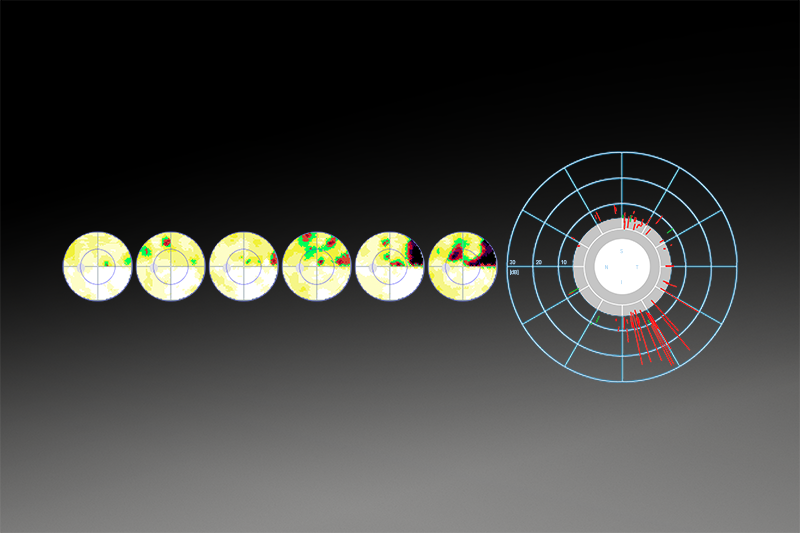
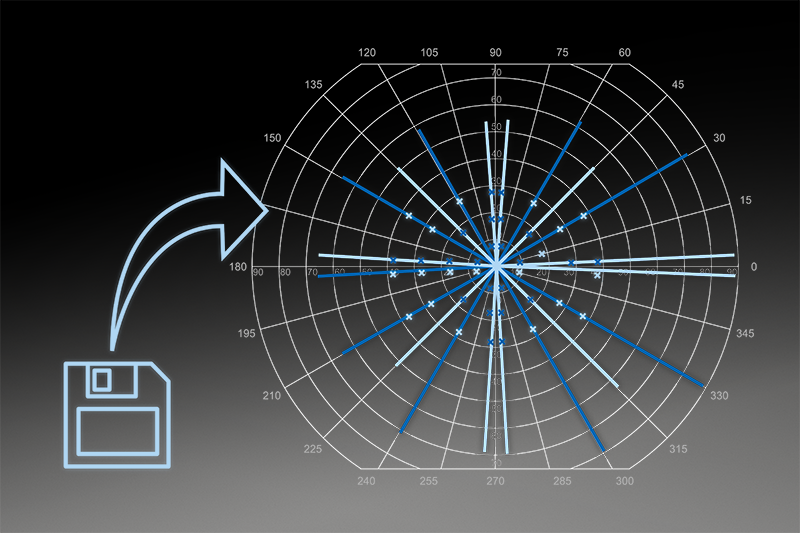
Get the most out of your glaucoma visual field with the highly sensitive Cluster Analysis, the intuitive Polar Analysis for structural comparisons and the easy-to-interpret EyeSuite Progression Analysis.

EYESUITE PROGRESSION ANALYSIS

Immediate identification of true change

Immediately identify levels of change with the EyeSuite Progression Analysis. It not only reveals whether change is significant, but also whether it is local or diffuse and how fast the change happening. For an effective clinical workflow, all results are displayed using intuitive graphical symbols and can be viewed directly in your office if the Octopus is networked.

EYESUITE PROGRESSION ANALYSIS

Assessing glaucomatous change from serial visual fields is not always easy, and expert agreement is moderate at best. Why not let EyeSuite Progression Analysis be your guide in assessing change? Red downward-pointing arrows show deterioration, green upward-pointing arrows show improvement and yellow diamonds show fluctuation at both at 1% and 5% significance level. This allows you to identify change at a glance.
The rate of glaucoma progression is key when choosing the right treatment for your patient. Therefore, EyeSuite Progression Analysis always shows you the rate of change in decibels per year. Now, you can quickly distinguish between fast and slowly progressing patients and adjust your treatment accordingly.

Looking at global visual field change is not always enough to fully assess visual field progression. Sometimes, diffuse loss due to cataracts overlaps with local glaucomatous change. In other cases, unspecific diffuse loss due to learning effects, fatigue or refractive errors, for example, can underlie small local changes. The indices Diffuse Defect DDc and Local Defect LDc are helpful in these cases. They quickly show you whether change is local, diffuse or both and further support your clinical decisions.
Are you looking for an effective way to encourage your patients' compliance? Then show them their visual field progression on the intuitive greyscale charts to help them to understand what glaucoma progression truly means for their vision. To do this effectively, network your Octopus perimeter and show the results directly on a computer screen in your examination room.
CLUSTER ANALYSIS/TREND

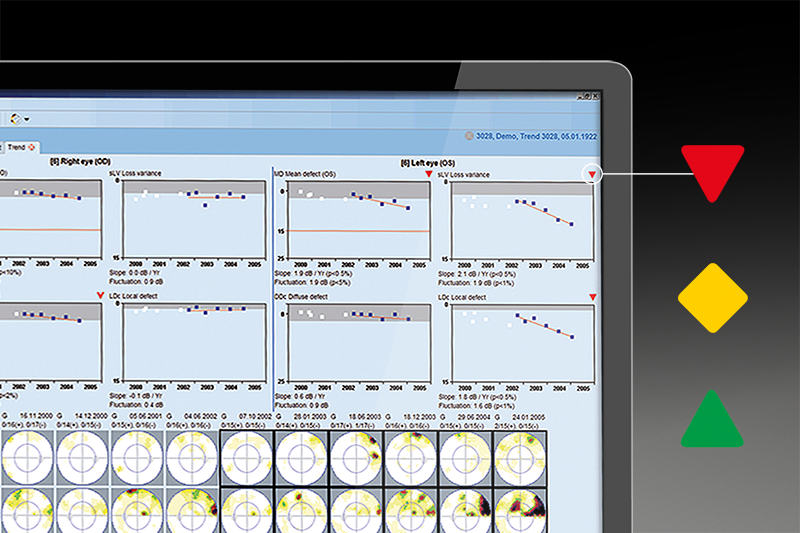
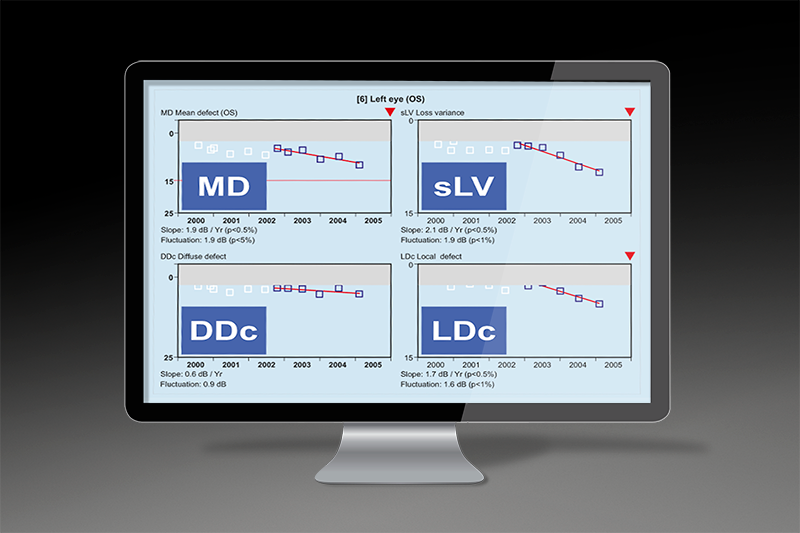
Sensitive glaucoma analysis

The sensitive Cluster Analysis groups visual field defects along nerve fibre bundles and combines high sensitivity with good specificity to detect early glaucomatous changes. Significant defects are highlighted and the cluster defects can be used for structural comparison. Cluster Analysis is available in both single field and trend view.
Using single point analysis or global indexes to begin facial loss by glaucoma is not always easy. The cluster analysis supports the discovery of glaucomatous defects by clusters of facial defects along the nerve fiber bundles. The defects are indicated as cluster MD (mean defect) to highlight crucial pathological areas. The cluster analysis works with the local average. Locally limited damage due to an incipient glaucoma is therefore more likely than with the global index mean defect (MD). Nevertheless, it is subject to less fluctuation than the individual test points.

Glaucomatous progression is often slow and influenced by fluctuation. Why not let Cluster Trend be your guide in assessing change ? It displays change in dB/year for each visual cluster and uses intuitive graphical symbols to highlight change. Red downward-pointing arrows show deteriorating, green upward-pointing arrows show improvement and yellow diamonds show fluctuation at both at 1% and 5% significance level. This allows you to identify glaucomatous change at a glance.
POLAR ANALYSIS/TREND

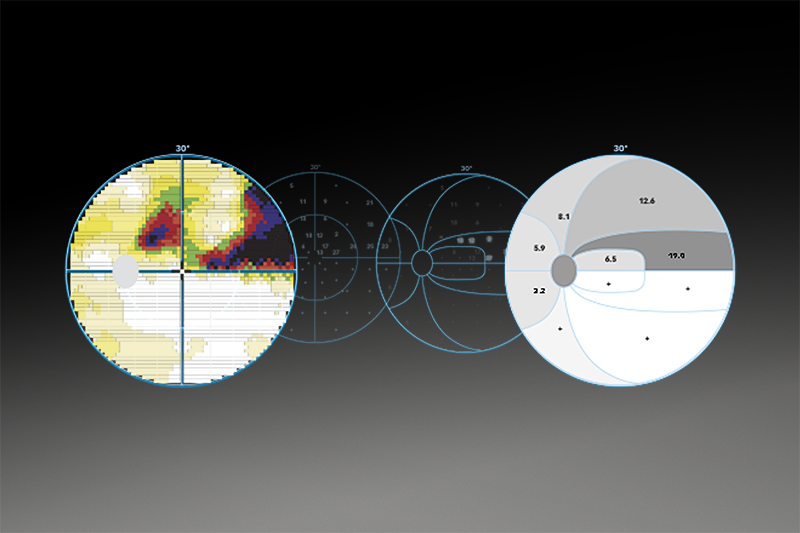
For intuitive structural comparison

Combining the results of both structure and function is key to obtaining a comprehensive assessment of the onset and progression of glaucoma. The Octopus Polar Analysis projects local visual field defects along the nerve fibers to the optic disk and displays them oriented as structural results. This makes structure-function correlation almost intuitive. Polar Analysis is available in both single field and trend view.
POLAR ANALYSIS/TREND

With Polar Analysis, the nerve fibre bundles that are in danger or defective are easily identified. Local defects are projected along the nerve fibres to the optic disk and are represented as red lines. The projected defects are vertically mirrored to look like a structural result and are scaled with rings for 10, 20 and 30 dB deviation.
Do you see glaucomatous progression in your structural results? Then consult Polar Trend to see whether you can find matching visual field deterioration. Polar Trend is based on the Polar Analysis. 
SEMI-AUTOMATED KINETIC PERIMETRY

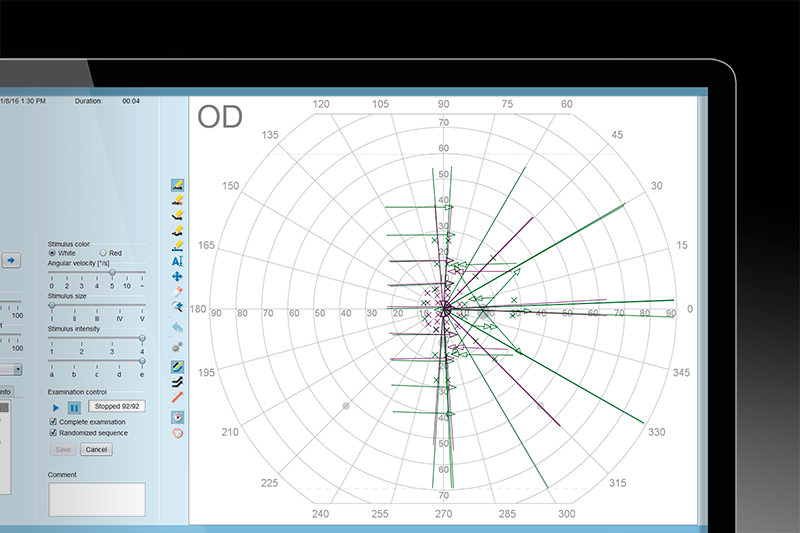
The modern Goldmann perimeter

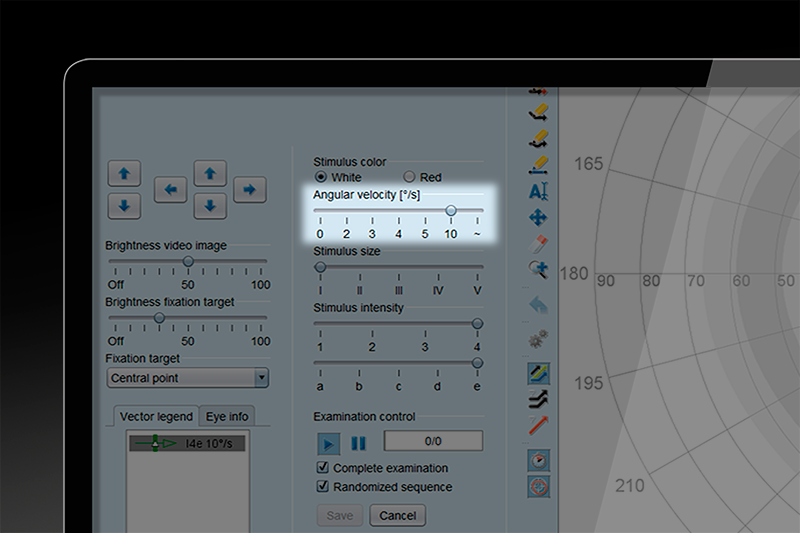
Appreciate the same characteristics and kinetic flexibility as offered by the original Goldmann perimeter and further benefit from simplified and more consistent operation.

SEMI-AUTOMATED KINETIC PERIMETRY

Comparable to the manual Goldmann perimeter

Enjoy the characteristics of the manual Goldmann perimeter in a modern device with automatic electronic data filing. As with the manual Goldmann perimeter, you can place vectors anywhere you want and even draw them manually in the standard Goldmann sizes, I to V, and intensities, 1a to 4e. In this way, you can achieve diagnostic results comparable to those from a manual Goldmann perimeter. 
SEMI-AUTOMATED KINETIC PERIMETRY

The Octopus 900 semi-automated kinetic perimetry retains all the original characteristics and specifications of a manual Goldmann perimeter. This allows for a smooth transition. Enjoy the same Goldmann stimulus sizes, I to V, and the same stimulus intensities, 1a to 4e, as you are used to. The design is also comparable. An original Goldmann bowl with a radius of 30 cm in all directions is used to project stimuli onto the Goldmann background intensity.

Place vectors anywhere and in any direction you want in either a semi-automatic or free-hand mode. Static points are also possible and isopters can be defined manually or in automatic mode if the isopter is regularly shaped. Equipped with all these possibilities, you can keep testing your patients with exactly the same methodologies as before.
SEMI-AUTOMATED KINETIC PERIMETRY

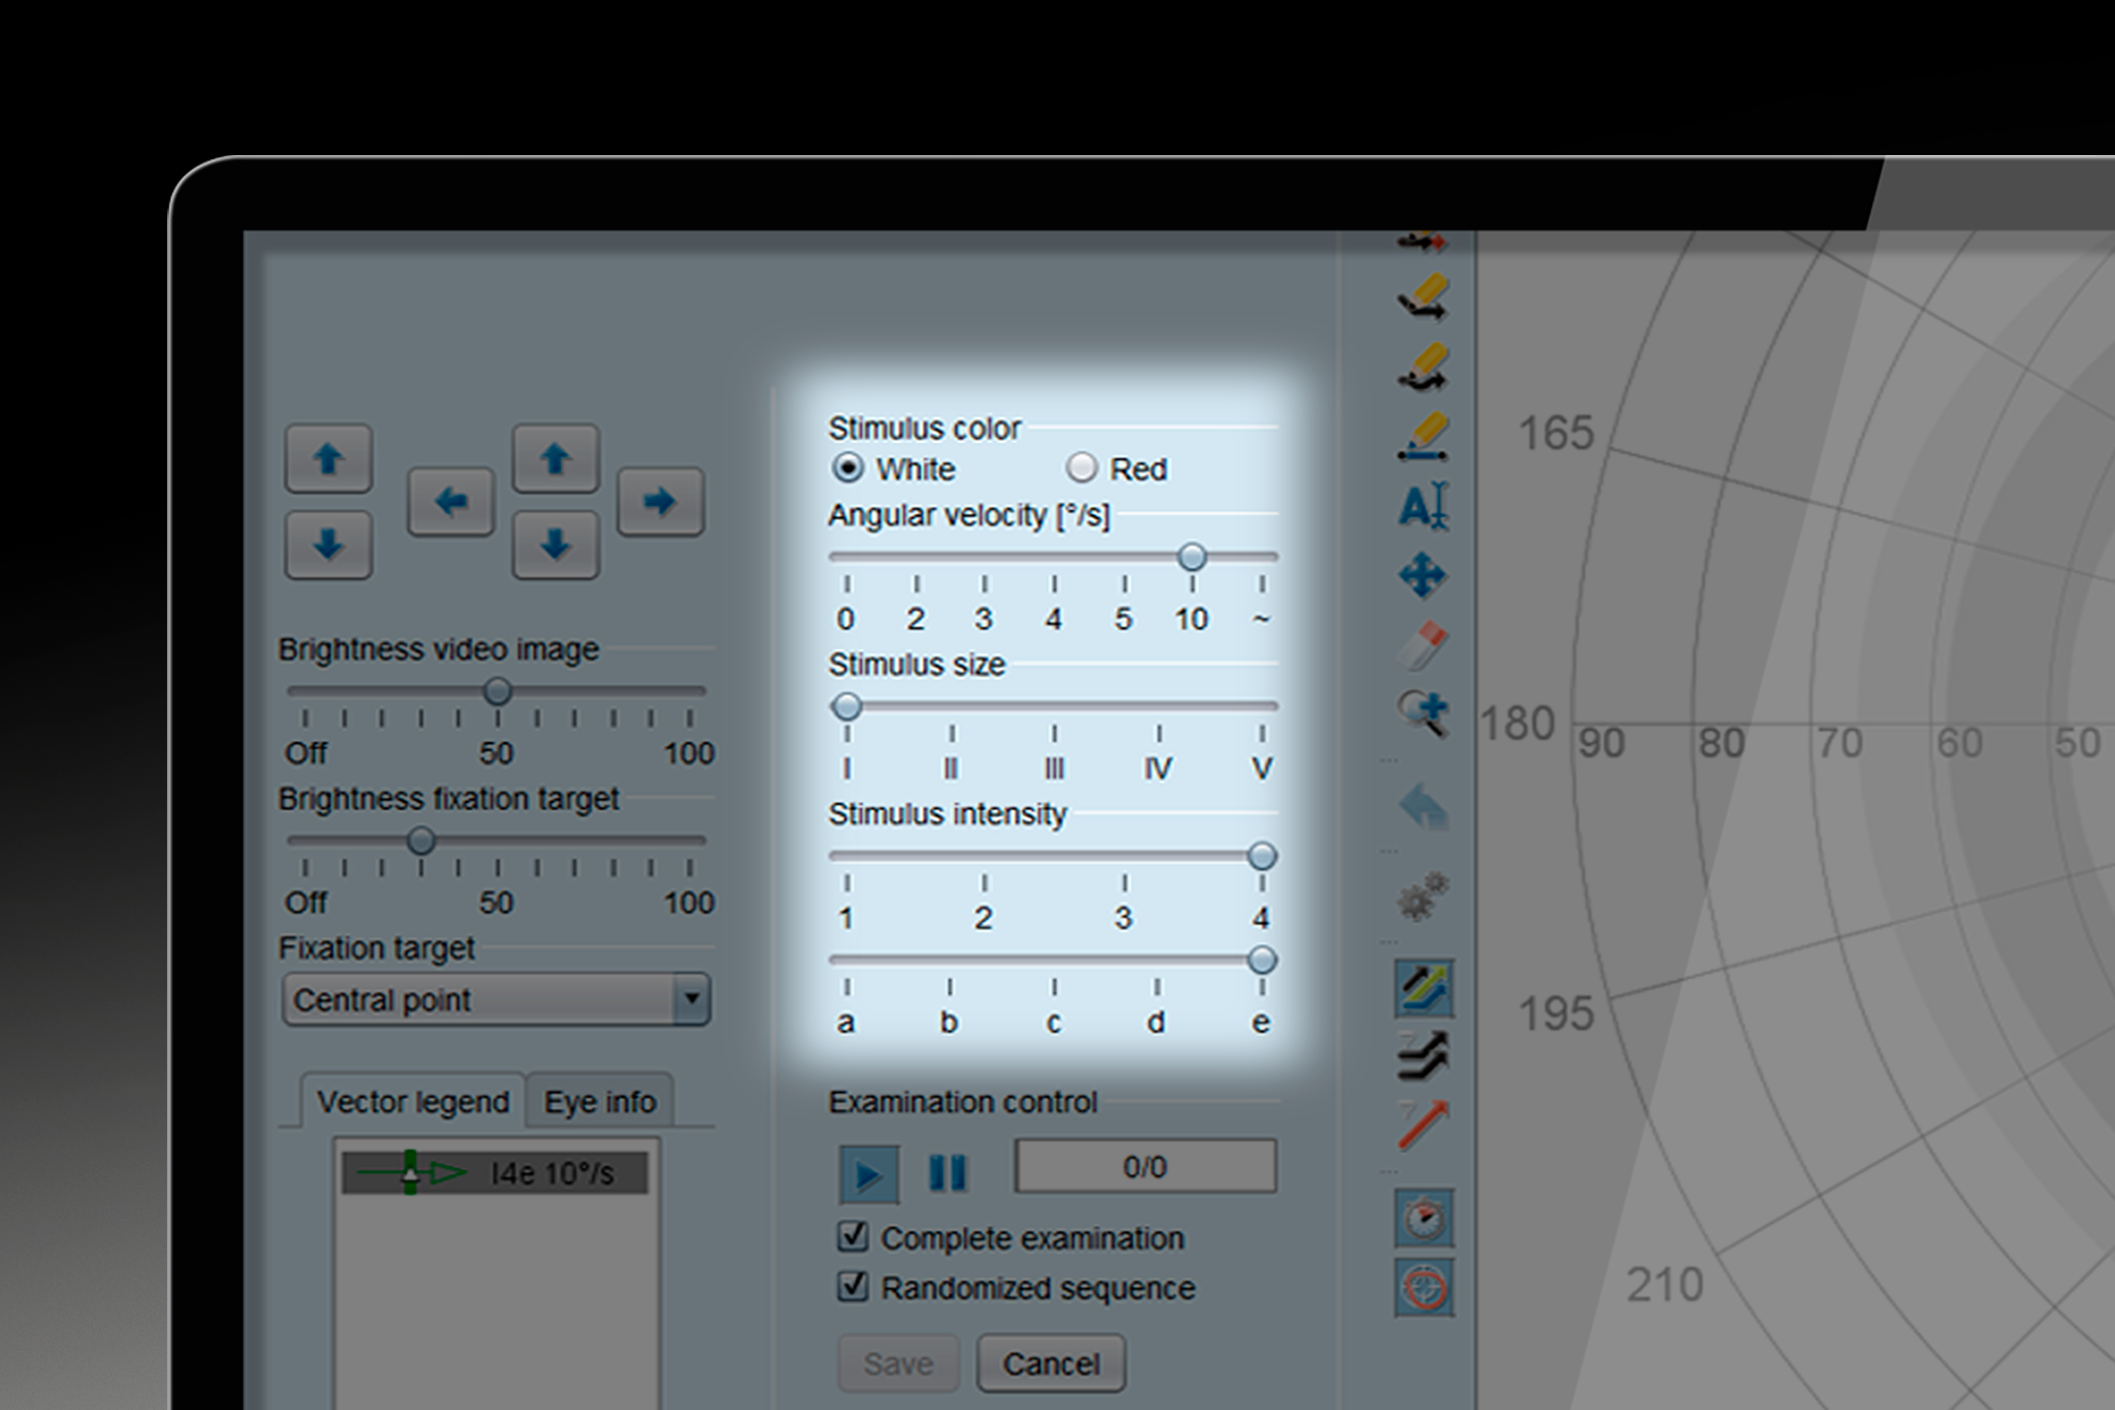
Simplified and more consistent operation

Benefit from the flexibility of a manual Goldmann but enjoy simplified and more consistent operation. Vector speed is now controlled and thus repeatable; the influence of both operator and patient reaction time is mostly eliminated and normal isopters provide guidance. And why not translate your standard clinical testing protocol into a template for all your patients that you can still adapt depending on the pathology?
Choose a fixed vector speed and standardise your testing for more consistent results. In addition, variability due to operator reaction time is completely eliminated, as patient responses are immediately marked by pressing the response button.

Patient reaction time adds variability to a kinetic examination, especially in patients with inconsistent reaction time between sessions. Octopus perimeters therefore allow you to measure patient reaction time by presenting stimuli in the patient's visible area and to compensate for it.
Standardise your clinical workflow without losing the flexibility to adapt to individual situations. Translate your kinetic testing protocols into a template and use that template for a standardised testing methodology independent of the operator. Then, depending on the pathology and patient response, adapt the template by adding and deleting vectors during the test. Or take advantage of templates developed by Dr. Fiona Rowe, PhD, from Liverpool University, which are available in the download section.
FIXATION CONTROL
FIXATION CONTROL

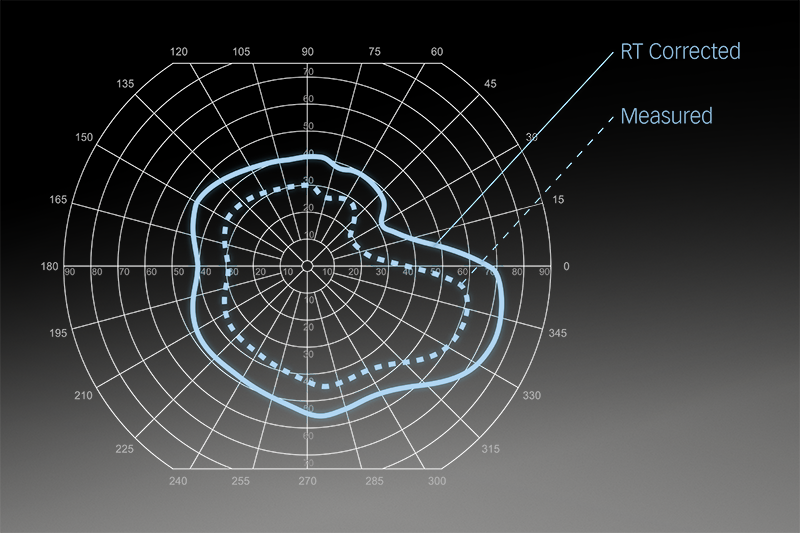
Perimetry you can trust

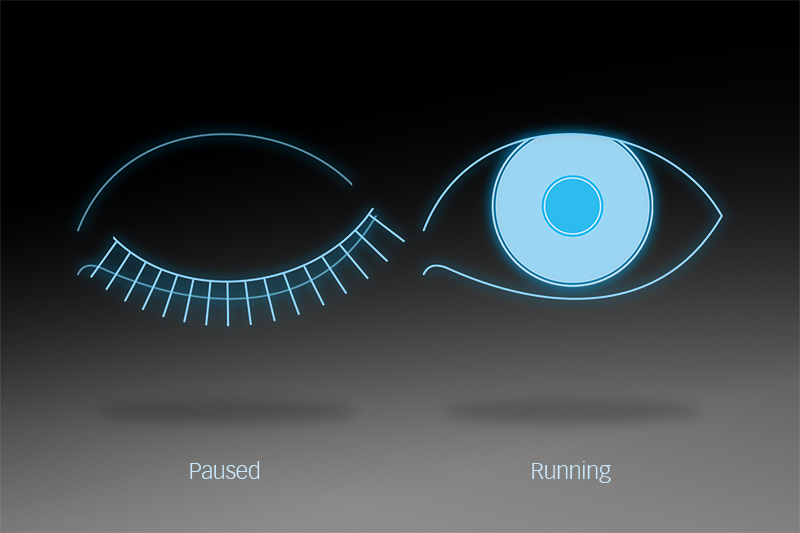
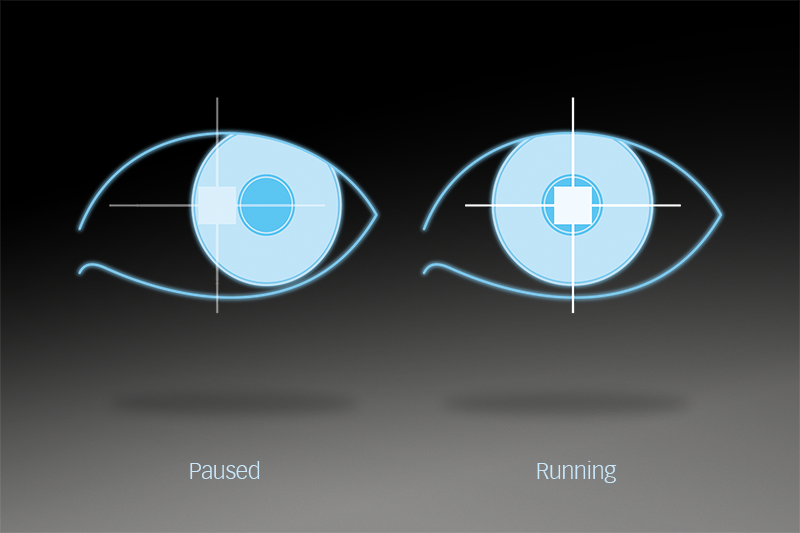
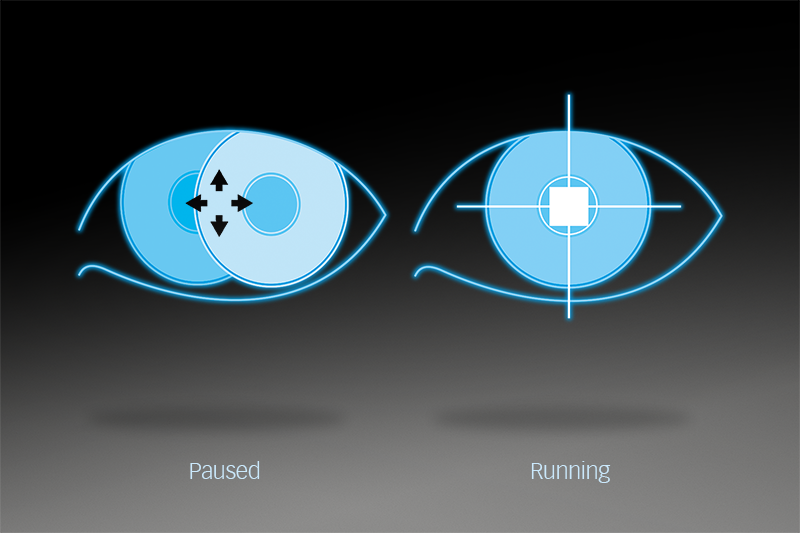
Enjoy the reliability of Octopus perimeters, for example with Octopus Fixation Control which automatically eliminates fixation losses from your visual field testing.

FIXATION CONTROL

Automatically eliminate fixation losses

Fixation losses due to low patient compliance are a major cause of unreliable visual fields. But you needn't worry any more. Fixation Control interrupts testing, when there is fixation loss, and automatically restarts, when the patient is properly fixating again. This ensures that each visual field point is reliably tested.
FIXATION CONTROL

Normal blinking prevents dry eyes and helps the patient to relax and concentrate during examination. With Octopus Blink Control, you need never worry again about missing a stimulus presented in static perimetry. Stimuli interrupted by the patient’s blinking are automatically repeated later during the test. This means that every test location is reliably tested.
Maintaining the correct pupil position during examination is essential for correct identification of the location of a defect. If the pupil position changes during stimulus presentation, due either to shifting of the head or eye movement, the Pupil Position Control automatically pauses the examination until the pupil is re-centred. The missed stimulus is automatically repeated later during the test. The result is a visual field that you can trust.

Remaining focused on the fixation target at all times is essential to prevent fixation losses. If patients rapidly move their eye to look for the next stimulus, Dart Control detects this fast movement and automatically interrupts the examination until a steady focus is achieved. Missed stimuli are automatically repeated later during the test making it easy to obtain reliable results.
Positioning the pupil in the centre of the trial lens is essential for preventing lens rim and anatomical artefacts. Automated Eye Tracking recognises the position of the pupil and keeps the pupil centred by automatically moving the head and chin rest into the ideal position. Thus, the Octopus 900 provides optimum conditions for reliable and instantaneous results.

Contact Control offers even more control and reliability by constantly assessing the correct patient position. If the patient pulls away from the instrument, it immediately notifies the operator and pauses the test to allow for re-positioning.
70 YEARS OF EXPERIENCE

Expertise you can trust

Enjoy the incorporated expertise of 70 years of experience in perimetry with your Octopus perimeter.

Since the invention of the manual Goldmann perimeter by Hans Goldmann in 1946, Haag-Streit has been a leader in perimetry which led amongst other things, to the invention of the first automated perimeter developed by Franz Fankhauser in 1974.

MANUAL GOLDMANN PERIMETER

Reference in perimetry right up to today

In 1945, Professor Hans Goldmann of the University of Berne developed, together with Haag-Streit, the Manual Goldmann perimeter. This instrument is still the reference for kinetic perimetry today and most of the basic definitions used by Professor Goldmann have become standards in perimetry today.
MANUAL GOLDMANN PERIMETER
THE FIRST AUTOMATED STATIC PERIMETER

A pioneer in automated static perimetry

In 1972, Franz Fankhauser and his colleagues developed the principles and concepts of automated perimetry which resulted in the design of the first automated static perimeter in 1974, the Octopus 201. Since then, Octopus perimeters have pioneered many significant innovations such as the G-pattern, global indices, fast strategies and outstanding software for visual field analysis.
EYESUITE
EYESUITE

Easy integration in your practice workflow

The EyeSuite software has been designed for optimum patient flow in busy practices. It controls all Haag-Streit devices and allows for them to be networked with other Haag-Streit devices, your office computer and your EMR system without the need for any expensive third-party software.